授業のレポートでせっかく作ったので公開する。
グラハムのアルゴリズムで凸包を求めるC++プログラム
#include<bits/stdc++.h>
#define rep(x,y) for(int x=0;x<y;x++)
using namespace std;
//x座標、y座標、偏角メンバを持つ構造体
struct Point{
    double x,y,arg;
    int nouse = 0;
    //x, yの値をもとに偏角を計算する
    void calc_arg(){
        if(x == 0){
            //0除算を防ぐため、x=0の時argを10に設定する。
            arg = 10;
            //原点の場合11に設定する
            if(y == 0)arg++;
            return;
        }
        //通常argは-π/2からπ/2までの範囲
        arg = atan(y / x);
    }
    //原点からの距離の二乗を求める関数
    double dist(){
        return x * x + y * y;
    }
    static bool comp_x(Point &a, Point &b){
        //x座標が等しい場合、y座標を基準にする
        if(a.x == b.x)return a.y < b.y;
        return a.x < b.x;
    }
    static bool comp_arg(Point &a, Point &b){
        return a.arg < b.arg;
    }
    static bool comp_nouse(Point &a, Point &b){
        return a.nouse < b.nouse;
    }
};
//符号付き面積を求める関数
double area2(const Point a, const Point b, const Point c){
    return a.x*b.y + a.y*c.x + b.x*c.y - b.y*c.x - c.y*a.x - a.y*b.x;
}
//一直線上に点が並んでしまうような集合の場合を考慮して、原点から最も遠いものを残して削除する関数
void delete_samearg(vector<Point> &p, int &n){
    int recent = 0;
    int nouse = 0;
    rep(i,n){
        if(i==0)continue;
        if(p[recent].arg == p[i].arg){
            nouse++;
            if(p[recent].dist() < p[i].dist()){
                p[recent].nouse = 1;
                recent = i;
            }else{
                p[i].nouse = 1;
            }
        }else recent = i;
    }
    n -= nouse;
    sort(p.begin(), p.end(), Point::comp_nouse);
    p.resize(n);
    sort(p.begin(), p.end(), Point::comp_arg);
}
int main(){
    int n;
    cin >> n;
    vector<Point> p(n);
    rep(i,n)cin >> p[i].x >> p[i].y;
    //xとyが一番小さい点をp[0]にする。
    iter_swap(min_element(p.begin(), p.end(), Point::comp_x), p.begin());
    Point p0 = p[0];
    //p[0]基準に原点を移動する
    rep(i,n){
        p[i].x -= p0.x;
        p[i].y -= p0.y;
        p[i].calc_arg();
    }
    //偏角順にソート
    sort(p.begin(), p.end(), Point::comp_arg);
    delete_samearg(p,n);
    vector<Point> sta;
    sta.push_back(p[n-1]);
    sta.push_back(p[0]);
    //print()を実行するとスタックの内容を出力するラムダ式を定義する
    auto print = [&](){
        cout << sta.size() << endl;
        rep(i,sta.size()){
            Point p = sta[i];
            printf("%8.7lf %7.7lf\n", p.x + p0.x, p.y + p0.y);
        }
    };
    //グラハムのアルゴリズム開始
    rep(i,n){
        if(i==0)continue;
        while(1){
            Point t = sta.back();
            sta.pop_back();
            Point s = sta.back();
            if(area2(s,t,p[i])> 0){
                sta.push_back(t);
                sta.push_back(p[i]);
                break;
            }
        }
    }
    sta.pop_back();
    //スタックの内容を出力
    print();
}
入力方法
はじめに点集合の大きさnを入力した後、それぞれの点についてx_i, y_iを入力する
出力方法
点集合の大きさmを出力した後、それぞれの点についてx_i, y_i を出力する
入力例
100
18.4670000 0.0410000
26.5000000 6.3340000
15.7240000 19.1690000
29.3580000 11.4780000
24.4640000 26.9620000
28.1450000 5.7050000
16.8270000 23.2810000
0.4910000 9.9610000
11.9420000 2.9950000
5.4360000 4.8270000
14.6040000 32.3910000
0.1530000 3.9020000
12.3820000 0.2920000
18.7160000 17.4210000
19.8950000 19.7180000
21.7260000 5.4470000
11.5380000 14.7710000
19.9120000 1.8690000
26.2990000 25.6670000
9.8940000 17.0350000
23.8110000 28.7030000
30.3330000 31.3220000
4.6640000 17.6730000
7.7110000 15.1410000
6.8680000 28.2530000
27.6440000 25.5470000
32.7570000 32.6620000
12.8590000 20.0370000
9.7410000 8.7230000
0.7780000 27.5290000
3.0350000 12.3160000
1.8420000 22.1900000
30.1060000 0.2880000
8.9420000 9.0400000
22.6480000 19.2640000
23.8050000 27.4460000
6.7290000 15.8900000
15.3500000 24.3700000
31.1010000 15.0060000
3.5480000 24.3930000
12.6230000 19.6290000
19.9540000 24.0840000
11.8400000 18.7560000
7.3760000 4.9660000
26.3080000 13.9310000
32.4390000 16.9440000
11.3230000 24.6260000
21.5380000 5.5370000
2.0820000 16.1180000
16.5410000 22.9290000
31.1150000 4.8330000
29.6580000 4.6390000
9.9300000 22.7040000
2.3060000 13.9770000
22.3860000 31.6730000
28.7450000 5.0210000
19.0720000 26.9240000
5.8290000 6.2700000
15.5730000 26.7770000
16.5120000 5.0970000
13.2900000 23.9860000
18.6360000 9.1610000
24.7670000 22.3550000
15.5740000 23.6550000
12.0520000 4.0310000
1.1500000 27.3500000
21.7240000 16.9410000
3.4300000 13.9660000
30.1910000 31.1070000
11.3370000 18.0070000
12.2870000 15.4570000
10.3830000 27.7530000
8.9090000 14.9450000
9.7580000 32.2090000
18.5880000 24.2210000
24.9460000 6.4220000
13.0300000 27.5060000
29.1680000 16.4130000
32.5910000 0.9000000
1.6550000 18.7620000
6.3590000 17.4100000
20.5370000 27.6240000
6.4830000 21.5480000
4.0410000 27.5950000
24.3500000 3.6020000
30.8360000 10.2910000
11.0200000 9.3740000
24.0210000 4.5960000
23.1990000 27.3480000
24.4840000 19.6680000
4.7340000 8.2810000
1.9990000 0.0530000
27.9380000 26.4180000
3.7880000 6.9000000
0.4670000 18.1270000
14.8930000 3.7280000
22.4830000 24.6480000
2.4210000 17.8070000
6.6170000 14.3100000
9.5140000 22.8130000
出力例
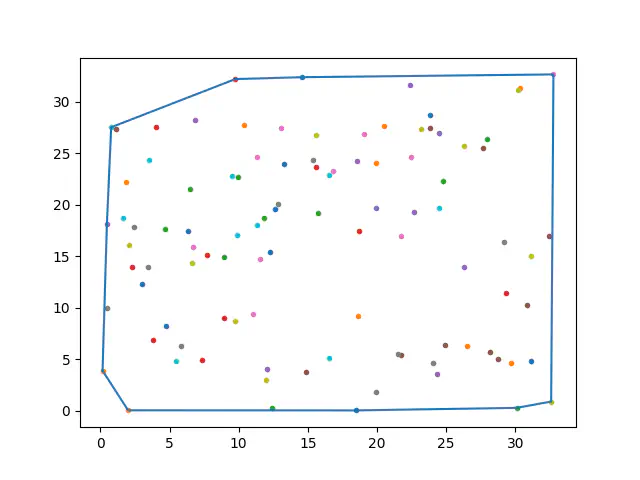
10
0.1530000 3.9020000
1.9990000 0.0530000
18.4670000 0.0410000
30.1060000 0.2880000
32.5910000 0.9000000
32.7570000 32.6620000
14.6040000 32.3910000
9.7580000 32.2090000
0.7780000 27.5290000
0.4670000 18.1270000
図に表してみるとこんな感じ
テストケースを自動で生成するC++プログラム
nを入力すると、ランダムな点集合を出力するプログラム
#include<bits/stdc++.h>
using namespace std;
#define rep(x,y) for(int x=0;x<y;x++)
int main(){
	int n;
	cin >> n;
	cout << n << endl;
	rep(i,n){
		printf("%7.7lf %7.7lf\n", (double)rand()/1000, (double)rand()/1000);
	}
}
凸包アルゴリズムを適用した図を出力するPythonプログラム
実行すると入力ファイルと出力ファイルを尋ねられるので、パスを標準入力する。
「グラハムのアルゴリズムで凸包を求めるC++プログラム」の入力と出力をテキストファイルで保存しておくのが良いだろう。
なおmatplotlibが必要なので、インストールされていない場合には以下コマンドをターミナルで実行する
pip install matplotlibimport matplotlib.pyplot as plt
print("enter input file name:")
input_stream = open(input(),'r')
print("enter output file name:")
output_stream = open(input(), 'r')
n = int(input_stream.readline())
for _ in range(n):
x, y = map(float, input_stream.readline().split())
plt.plot(x,y,marker='.')
m = int(output_stream.readline())
linex = []
liney = []
for i in range(m):
x, y = map(float, output_stream.readline().split())
if i == 0:
first = (x, y)
linex.append(x)
liney.append(y)
linex.append(first[0])
liney.append(first[1])
plt.plot(linex, liney)
plt.show()